Glossary of probability and statistics

Look up
Appendix:Glossary of probability and statistics in Wiktionary, the free dictionary.
This glossary of statistics and probability is a list of definitions of terms and concepts used in the mathematical sciences of statistics and probability, their sub-disciplines, and related fields. For additional related terms, see Glossary of mathematics and Glossary of experimental design.
A
admissible decision rule
algebra of random variables
alternative hypothesis
analysis of variance
atomic event
Another name for
elementary event.
B
bar chart
Bayes' theorem
Bayes estimator
Bayes factor
Bayesian inference
bias
1. Any feature of a
sample that is not representative of the larger
population.
2. The difference between the expected value of an
estimator and the true value.
binary data
Data that can take only two values, usually represented by the
binary digits 0 and 1.
binomial distribution
bivariate analysis
A type of quantitative statistical analysis in which exactly two
variables are analyzed, for the purpose of determining the empirical relationship between them. Contrast
multivariate analysis.
blocking
In experimental design, the arranging of experimental units in groups ("blocks") that are similar to one another. Blocking is often used to manage the problem of
pseudoreplication.
Box–Jenkins method
box plot
C
causal study
A statistical study in which the objective is to measure the effect of some
variable on the outcome of a different variable. For example, a causal study might ask the question: "How will my headache feel if I take aspirin, versus if I do not take aspirin?" Causal studies may be either experimental or observational.
central limit theorem
central moment
characteristic function
chi-squared distribution
chi-squared test
cluster analysis
cluster sampling
complementary event
completely randomized design
computational statistics
The study of statistical methods that are enabled by using computational methods, at the interface of statistics and
computer science.
concomitants
In a statistical study, any variables whose values are unaffected by experimental treatments, such as a unit’s age, gender, and cholesterol level before starting an experimental diet.
conditional distribution
Given two jointly distributed random variables X and Y, the conditional probability distribution of Y given X (written "Y | X") is the probability distribution of Y when X is known to be a particular value.
conditional probability
The
probability of some event A, assuming the occurrence of event B. In mathematical notation, conditional probability is written P(A|B), and is read "the probability of A, given B".
conditional probability distribution
confidence interval (CI)
In inferential statistics, a range of plausible values for some unknown
parameter, such as a
population mean, defined as an interval with a lower bound and an upper bound.
The precise values of these bounds are calculated from a pre-determined
confidence level, chosen by the researcher. The confidence level represents the frequency of intervals that, over the long run, capture the true value of the unknown parameter; i.e. 95% of confidence intervals computed at the 95% confidence level contain the true value, and likewise for other confidence levels. For example, based on a study of sleep habits among a random sample of 100 people, a researcher may estimate at the 95% confidence level that the overall population sleeps somewhere between 5 and 9 hours per night. There is a 95% chance that the true population mean falls within this interval, because 95% of random samples taken from this same population will yield 95% confidence intervals that contain the true mean.
confidence level
A number indicating the probability that the
confidence interval (range) captures the true
population mean. For example, a confidence interval with a 95% confidence level has a 95% chance of capturing the population mean. Technically, this means that, if the experiment were repeated many times, 95% of the CIs computed at this level would contain the true population mean.
confounder
A
variable that influences both the
dependent variable and the
independent variable, causing a spurious association. The existence of hidden confounding variables is an important quantitative explanation why
correlation does not imply causation: if changes in two variables appear to be correlated, it is risky to presume that one change causes the other because it is possible that one or more unidentified confounders has in fact caused the changes in both variables. A classic example is the correlation between increased consumption of ice cream and increased crime in the summer. It is irrational to assume that eating more ice cream makes people commit more crime, or vice versa; it is more likely that one or more additional variables, e.g. warmer weather, increase both ice cream consumption and crime simultaneously. In this example, warmer weather is the confounder.
conjugate prior
continuous variable
convenience sampling
correlation
A numeric measure of the strength of a linear relationship between two random variables (one can use it to quantify, for example, how shoe size and height are correlated in the population). An example is the
Pearson product-moment correlation coefficient, which is found by dividing the
covariance of the two variables by the product of their
standard deviations.
Independent variables, by definition, have a correlation of 0. A population correlation is often represented by the symbol
ρ
{\displaystyle \rho }

, and a sample correlation by
r
{\displaystyle r}

.</ref>
count data
Data arising from
counting, and which can therefore take only non-negative
integer values.
covariance
Given two random variables X and Y, with expected values
E
(
X
)
=
μ
{\displaystyle E(X)=\mu }

and
E
(
Y
)
=
ν
{\displaystyle E(Y)=\nu }

, the expected value of random variable
(
X
−
μ
)
(
Y
−
ν
)
{\displaystyle (X-\mu )(Y-\nu )}

, written in statistical notation as
cov
(
X
,
Y
)
{\displaystyle \operatorname {cov} (X,Y)}

. The covariance is used for measuring
correlation; it can be interpreted as the degree to which the two variables change simultaneously with each other or "co-vary".
D
data
data analysis
data set
A sample and the associated
data points.
data point
A typed measurement — it can be a
Boolean value, a real number, a vector (in which case it is also called a data vector), etc.
decision rule
decision theory
degrees of freedom
density estimation
dependence
dependent variable
descriptive statistics
design of experiments
deviation
discrete variable
dot plot
double counting
E
elementary event
An event which contains only a single outcome in the
sample space; in a set of possibilities, a possibility that can occur in precisely one way. For example, when pulling a card from a standard deck of
playing cards, 'pulling the jack of spades' is an elementary event (because there is only one jack of spades in the entire deck), while 'pulling a king or an ace' is not (because there are a combined four kings and four aces in the deck).
estimation theory
The branch of statistics concerned with estimating the values of
parameters based on measured empirical data with a
random component. The parameters describe an underlying physical setting in such a way that their values affect the distribution of the measured data; an
estimator attempts to use the measurements to approximate the unknown parameters.
estimator
A function of the known data that is used to estimate an unknown
parameter; an estimate is the result of the actual application of the function to a particular set of data. For example, the
mean can be used as an estimator.
expected value
The sum of the probabilities of each possible outcome of an
experiment multiplied by their corresponding
payoff or "value". Thus, it represents the average amount one "expects" to win per bet if bets with identical odds are repeated many times. For example, the expected value of rolling a fair six-sided die is 3.5. The concept is, intuitively, a generalization of the weighted average of all possible outcomes of a particular procedure or experiment, and can be viewed as the
arithmetic mean of a large number of independent realizations of the experiment. The expected value of random variable X is typically written as E(X) for the expectation operator, and
μ
{\displaystyle \mu }

(
mu) for the parameter.
experiment
Any procedure which can be infinitely repeated and which has a well-defined set of outcomes.
exponential family
event
A subset of the
sample space of a procedure or
experiment (i.e. a possible outcome) to which a probability can be assigned. For example, on rolling a die, "getting a three" is an event (with a probability of 1⁄6 if the die is fair), as is "getting a five or a six" (with a probability of 1⁄3).
F
factor analysis
factorial experiment
frequency
frequency distribution
frequency domain
frequentist inference
G
general linear model
generalized linear model
grouped data
H
histogram
An approximate graphical representation of the distribution of numerical data. A histogram displays this distribution by dividing the entire
range of values into a series of consecutive, non-overlapping intervals and then counting how many instances of the dataset fall into each interval.
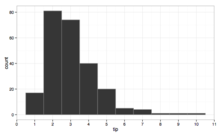
A
histogram showing the distribution of tips given in a restaurant
I
independence
independent variable
interquartile range (IQR)
A measure of the statistical dispersion or spread of a dataset, defined as the difference between the 25th and 75th
percentiles of the data. To calculate the IQR, the dataset is divided into four rank-ordered even parts or
quartiles, the boundaries between which, at the 25th, 50th, and 75th percentiles, are denoted
Q
{\displaystyle Q}

1,
Q
{\displaystyle Q}
2, and
Q
{\displaystyle Q}
3, respectively; the IQR =
Q
{\displaystyle Q}
3
−
{\displaystyle -}

Q
{\displaystyle Q}
1.
J
joint distribution
Given two random variables X and Y, the joint distribution of X and Y is the
probability distribution of X and Y together.
joint probability
The
probability of two
events occurring together. The joint probability of A and B is written
P
(
A
∩
B
)
{\displaystyle P(A\cap B)}

or
P
(
A
,
B
)
{\displaystyle P(A,\ B)}

.
K
Kalman filter
kernel
kernel density estimation
kurtosis
A measure of the "tailedness" of the
probability distribution of a real-valued random variable. There are different ways of quantifying, estimating, and interpreting kurtosis, but a common interpretation is that kurtosis represents the degree to which the shape of the distribution is influenced by infrequent extreme observations (
outliers); in this case, higher kurtosis means more of the
variance is due to infrequent extreme deviations, as opposed to frequent modestly sized deviations.
L
L-moment
law of large numbers (LLN)
A theorem according to which the average of the results obtained from performing the same experiment a large number of times should be close to the experiment's
expected value, and tends to become closer to the expected value as more trials are performed. The law suggests that a sufficiently large number of trials is necessary for the results of any experiment to be considered reliable, and by extension that performing only a small number of trials may produce an incomplete or misleading interpretation of the experiment's outcomes.

A graph illustrating the
law of large numbers: the observed results of repeatedly rolling a fair die (green line) quickly approach the theoretical
expected value of a single roll (blue line) as the number of times the die is rolled increases
likelihood function
A conditional probability function considered a function of its second argument with its first argument held fixed. For example, imagine pulling a numbered ball with a number k from a bag of n balls, numbered 1 to n; a likelihood function for the random variable N could be described as the probability of pulling k given that there are n balls: the likelihood will be 1/n for n greater than or equal to k, and 0 for n smaller than k. Unlike a probability distribution function, this likelihood function will not sum up to 1 on the
sample space.
loss function
likelihood-ratio test
M
M-estimator
marginal distribution
Given two
jointly distributed random variables X and Y, the marginal distribution of X is simply the
probability distribution of X when information about Y is ignored.
marginal likelihood
marginal probability
The probability of a given event, ignoring any information about other events. The marginal probability of A is written P(A). Contrast
conditional probability.
Markov chain Monte Carlo
mathematical statistics
maximum likelihood estimation
mean
1. The
expected value of a random variable.
2. The
arithmetic mean, i.e. the mathematical average of a set of numerical values, calculated by dividing the sum of the values by the number of values.
median
median absolute deviation
mode
moving average
A series of mathematical averages or
means of different subsets of a larger data set, usually computed so as to understand trends in the data set over time.
multimodal distribution
multivariate analysis
multivariate kernel density estimation
multivariate random variable
A vector whose components are random variables on the same probability space.
mutual exclusivity
mutual independence
A collection of events is said to be mutually independent if for any subset of the collection, the joint probability of all events occurring is equal to the product of the joint probabilities of the individual events. Think of the result of a series of coin-flips. This is a stronger condition than pairwise independence.
N
nonparametric regression
nonparametric statistics
non-sampling error
normal distribution
normal probability plot
null hypothesis (H0)
The statement being tested in a test of
statistical significance; usually a statement of 'no effect' or 'no difference'.
For example, in a test of whether light has an effect on sleep, the null hypothesis would be that light has no effect on sleep (i.e. sleep patterns are the same regardless of the lighting conditions). The null hypothesis is an expression of the expectation that the
dependent variable will not change significantly as the
independent variable is modified; statistical significance is measured and reported according to the degree to which this expectation is met. Contrast
alternative hypothesis.
O
opinion poll
optimal decision
optimal design
outlier
P
p-value
pairwise independence
A set of random variables, any two of which are independent.
parameter
Any measured quantity of a statistical
population that summarizes or describes an aspect of the population, e.g. a
mean or a
standard deviation; often a quantity to be estimated based on the corresponding quantity calculated by drawing
random samples from the population. Can be a population parameter, a distribution parameter, or an unobserved parameter.
particle filter
percentile
pie chart
point estimation
power
prior probability
In
Bayesian inference, prior beliefs or other information that is available before new data or observations are taken into account.
population parameter
See
parameter.
posterior probability
The result of a
Bayesian analysis that encapsulates the combination of prior beliefs or information (the
prior probability) with observed data.
principal component analysis (PCA)
probability
probability density
The probability in a continuous probability distribution. For example, you can't say that the probability of a man being six feet tall is 20%, but you can say he has 20% of chances of being between five and six feet tall. Probability density is given by a
probability density function. Contrast
probability mass.
probability density function
The probability distribution for a continuous random variable.
probability distribution
A function that gives the probability of all elements in a given space; see
List of probability distributions.
probability measure
The
probability of events in a
probability space.
probability plot
probability space
A
sample space over which a
probability measure has been defined.
Q
quantile
A particular point or value at which the range of a probability distribution is divided into continuous intervals with equal probabilities, or at which the observations in a sample are divided in the same way. The number of groups into which the range is divided is always one greater than the number of quantiles dividing them. Commonly used quantiles include
quartiles (which divide a range into four groups),
deciles (ten groups), and
percentiles (one hundred groups). The groups themselves are termed halves, thirds, quarters, etc., though the terms for the quantiles are sometimes used to refer to the groups, rather than to the cut points.
quartile
A type of
quantile which divides a range of data points into four groups, termed quarters, of equal size. For any quartile-divided dataset, there are exactly three quartiles or cut points that create the four groups. The first quartile (
Q
{\displaystyle Q}
1) is defined as the middle data point or value that is halfway between the smallest value (minimum) and the
median of the dataset, such that 25 percent of the data lies below this quartile. The second quartile (
Q
{\displaystyle Q}
2) is the median itself, with 50 percent of the data below this point. The third quartile (
Q
{\displaystyle Q}
3) is defined as the middle value halfway between the median and the largest value (maximum) of the dataset, such that 75 percent of the data lies below this quartile. Because the data must be ordered from smallest to largest in order to compute them, quartiles are a type of
order statistic.

A
normal distribution divided by three
quartiles into four quarters. Note that each of the quarters occupies the same total area under the curve, equal to 25 percent of the distribution.
quota sampling
R
random variable
A measurable function on a probability space, often real-valued. The distribution function of a random variable gives the probability of the different values of the variable. The mean and variance of a random variable can also be derived. See also
discrete random variable and
continuous random variable.
randomized block design
range
The length of the smallest interval which contains all the data.
recursive Bayesian estimation
regression analysis
repeated measures design
response variable
Any
variable whose value is or is expected to be affected by an experimental treatment, or by changes in one or more other variables; e.g. cholesterol levels after following a particular diet for six months. Response variables are those that change or respond to some phenomenon under study. The term is often used interchangeably with
dependent variable.
restricted randomization
robust statistics
round-off error
S
sample
That part of a
population which is actually observed.
sample covariance
sample mean
The
arithmetic mean of a
sample of values drawn from a population, commonly denoted by
x
¯
{\displaystyle {\overline {x}}}

. An example is the average test score of a subset of 10 students from a class. The sample mean is used as an estimator of the population mean, which in this example would be the average test score of all of the students in the class.
sample space
The set of possible outcomes of an experiment. For example, the sample space for rolling a six-sided die will be {1, 2, 3, 4, 5, 6}.
sampling
A process of selecting observations to obtain knowledge about a population. There are many methods to choose on which sample to do the observations.
sampling bias
sampling distribution
The
probability distribution, under repeated sampling of the population, of a given statistic.
sampling error
scatter plot
scale parameter
significance level
simple random sample
Simpson's paradox
skewness
A measure of the asymmetry of the
probability distribution of a real-valued random variable about its
mean. Roughly speaking, a distribution has positive skew (right-skewed) if the higher tail is longer, and negative skew (left-skewed) if the lower tail is longer. Perfectly symmetrical distributions always have zero skewness, though zero skewness does not necessarily imply a symmetrical distribution.
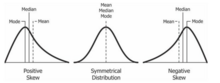
The
mean and
median of a
skewed distribution (left and right) may differ substantially from those of a symmetrical distribution (center) with zero skewness.
spaghetti plot
spectrum bias
standard deviation
The most commonly used measure of statistical dispersion. It is the
square root of the
variance, and is generally denoted with the lowercase Greek letter
σ
{\displaystyle \sigma }

(
sigma).
standard error
standard score
statistic
The result of applying a statistical algorithm to a data set. It can also be described as an observable random variable.
statistical dispersion
statistical graphics
statistical hypothesis testing
statistical independence
Two events are independent if the outcome of one does not affect that of the other (for example, getting a 1 on a single die roll does not affect the probability of getting a 1 on a second roll). Similarly, when we assert that two random variables are independent, we intuitively mean that knowing something about the value of one of them does not yield any information about the value of the other.
statistical inference
Inference about a population based on a random sample drawn from that population or, more generally, about a random process from its observed behavior during a finite period of time.
statistical model
statistical population
A set of entities about which statistical inferences are to be drawn, often based on random sampling. One can also talk about a population of measurements or values.
statistical dispersion
A measure of the diversity within a set of data, expressed by the
variance or the
standard deviation.
statistical parameter
A
parameter that indexes a family of probability distributions.
statistical significance
statistics
Student's t-test
stem-and-leaf display
stratified sampling
survey methodology
survival function
survivorship bias
symmetric probability distribution
systematic sampling
T
test statistic
tidy data
Standard for structuring data such that "each variable is a column, each observation is a row, and each type of observational unit is a table". It is equivalent to Codd's
third normal form.
time domain
time series
time series analysis
time series forecasting
treatments
Variables in a statistical study that are conceptually manipulable. For example, in a health study, following a certain diet is a treatment whereas age is not.
trial
Can refer to each individual repetition when talking about an experiment composed of any fixed number of them. As an example, one can think of an experiment being any number from one to n coin tosses, say 17. In this case, one toss can be called a trial to avoid confusion, since the whole experiment is composed of 17 ones.
trimmed estimator
type I and type II errors
U
unimodal probability distribution
units
In a statistical study, the objects to which treatments are assigned. For example, in a study examining the effects of smoking cigarettes, the units would be people.
V
variance
A measure of its statistical dispersion of a random variable, indicating how far from the expected value its values typically are. The variance of random variable X is typically designated as
var
(
X
)
{\displaystyle \operatorname {var} (X)}

,
σ
X
2
{\displaystyle \sigma _{X}^{2}}

, or simply
σ
2
{\displaystyle \sigma ^{2}}

W
weighted arithmetic mean
weighted median
X
XOR, exclusive disjunction
Y
Yates's correction for continuity, yules correction
Z
z-test
See also
References
- ^ a b c d e Reiter, Jerome (January 24, 2000). "Using Statistics to Determine Causal Relationships". American Mathematical Monthly. 107 (1): 24–32. doi:10.2307/2589374. JSTOR 2589374.
- ^ a b Pav Kalinowski. Understanding Confidence Intervals (CIs) and Effect Size Estimation. Association for Psychological Science Observer April 10, 2010. http://www.psychologicalscience.org/index.php/publications/observer/2010/april-10/understanding-confidence-intervals-cis-and-effect-size-estimation.html
- ^ Moore, David; McCabe, George (2003). Introduction to the Practice of Statistics (4 ed.). New York: W.H. Freeman and Co. p. 438. ISBN 9780716796572.
- ^ Wickham, Hadley (2014). "Tidy Data" (PDF). Journal of Statistical Software. 59 (10). doi:10.18637/jss.v059.i10.
External links


 A histogram showing the distribution of tips given in a restaurant
 A graph illustrating the law of large numbers: the observed results of repeatedly rolling a fair die (green line) quickly approach the theoretical expected value of a single roll (blue line) as the number of times the die is rolled increases
likelihood function
A conditional probability function considered a function of its second argument with its first argument held fixed. For example, imagine pulling a numbered ball with a number k from a bag of n balls, numbered 1 to n; a likelihood function for the random variable N could be described as the probability of pulling k given that there are n balls: the likelihood will be 1/n for n greater than or equal to k, and 0 for n smaller than k. Unlike a probability distribution function, this likelihood function will not sum up to 1 on the sample space.
loss function
likelihood-ratio test
A graph illustrating the law of large numbers: the observed results of repeatedly rolling a fair die (green line) quickly approach the theoretical expected value of a single roll (blue line) as the number of times the die is rolled increases
likelihood function
A conditional probability function considered a function of its second argument with its first argument held fixed. For example, imagine pulling a numbered ball with a number k from a bag of n balls, numbered 1 to n; a likelihood function for the random variable N could be described as the probability of pulling k given that there are n balls: the likelihood will be 1/n for n greater than or equal to k, and 0 for n smaller than k. Unlike a probability distribution function, this likelihood function will not sum up to 1 on the sample space.
loss function
likelihood-ratio test
 A normal distribution divided by three quartiles into four quarters. Note that each of the quarters occupies the same total area under the curve, equal to 25 percent of the distribution.
quota sampling
A normal distribution divided by three quartiles into four quarters. Note that each of the quarters occupies the same total area under the curve, equal to 25 percent of the distribution.
quota sampling
 The mean and median of a skewed distribution (left and right) may differ substantially from those of a symmetrical distribution (center) with zero skewness.
spaghetti plot
spectrum bias
standard deviation
The most commonly used measure of statistical dispersion. It is the square root of the variance, and is generally denoted with the lowercase Greek letter
σ
{\displaystyle \sigma }
(sigma).
standard error
standard score
statistic
The result of applying a statistical algorithm to a data set. It can also be described as an observable random variable.
statistical dispersion
statistical graphics
statistical hypothesis testing
statistical independence
Two events are independent if the outcome of one does not affect that of the other (for example, getting a 1 on a single die roll does not affect the probability of getting a 1 on a second roll). Similarly, when we assert that two random variables are independent, we intuitively mean that knowing something about the value of one of them does not yield any information about the value of the other.
statistical inference
Inference about a population based on a random sample drawn from that population or, more generally, about a random process from its observed behavior during a finite period of time.
statistical model
statistical population
A set of entities about which statistical inferences are to be drawn, often based on random sampling. One can also talk about a population of measurements or values.
statistical dispersion
A measure of the diversity within a set of data, expressed by the variance or the standard deviation.
statistical parameter
A parameter that indexes a family of probability distributions.
statistical significance
statistics
Student's t-test
stem-and-leaf display
stratified sampling
survey methodology
survival function
survivorship bias
symmetric probability distribution
systematic sampling
The mean and median of a skewed distribution (left and right) may differ substantially from those of a symmetrical distribution (center) with zero skewness.
spaghetti plot
spectrum bias
standard deviation
The most commonly used measure of statistical dispersion. It is the square root of the variance, and is generally denoted with the lowercase Greek letter
σ
{\displaystyle \sigma }
(sigma).
standard error
standard score
statistic
The result of applying a statistical algorithm to a data set. It can also be described as an observable random variable.
statistical dispersion
statistical graphics
statistical hypothesis testing
statistical independence
Two events are independent if the outcome of one does not affect that of the other (for example, getting a 1 on a single die roll does not affect the probability of getting a 1 on a second roll). Similarly, when we assert that two random variables are independent, we intuitively mean that knowing something about the value of one of them does not yield any information about the value of the other.
statistical inference
Inference about a population based on a random sample drawn from that population or, more generally, about a random process from its observed behavior during a finite period of time.
statistical model
statistical population
A set of entities about which statistical inferences are to be drawn, often based on random sampling. One can also talk about a population of measurements or values.
statistical dispersion
A measure of the diversity within a set of data, expressed by the variance or the standard deviation.
statistical parameter
A parameter that indexes a family of probability distributions.
statistical significance
statistics
Student's t-test
stem-and-leaf display
stratified sampling
survey methodology
survival function
survivorship bias
symmetric probability distribution
systematic sampling