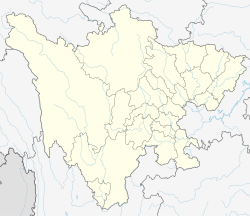
Hanyuan County
| Hanyuan County 汉源县 • ꉴꑼꑤ • ཧན་ཡོན་རྫོང | |
|---|---|
| County | |
 Location of Hanyuan County (red) in Ya'an City (yellow) and Sichuan province Location of Hanyuan County (red) in Ya'an City (yellow) and Sichuan province | |
 | |
| Coordinates: 29°20′38″N 102°39′07″E / 29.344°N 102.652°E / 29.344; 102.652 | |
| Country | China |
| Province | Sichuan |
| Prefecture-level city | Ya'an |
| County seat | Fulin Town |
| Area | |
| • Total | 2,349 km2 (907 sq mi) |
| Population (2020) | |
| • Total | 285,558 |
| • Density | 120/km2 (310/sq mi) |
| Time zone | UTC+8 (China Standard) |
| Website | www.hanyuan.gov.cn |
Hanyuan County (simplified Chinese: 汉源县; traditional Chinese: 漢源縣; pinyin: Hànyuán Xiàn) is a county of Sichuan Province, China. It is under the administration of Ya'an city. The principal town is Shirong. The Pubugou Hydropower Station in the county has caused displacement problems for thousands of villagers, and in 2004 some 20,000 villagers protested against it.
Administrative divisions
Hanyuan County administers 12 towns, 4 townships and 5 ethnic townships:
- Fulin Town (富林镇)
- Jiuxiang Town (九襄镇)
- Wusihe Town (乌斯河镇)
- Yidong Town (宜东镇)
- Fuzhuang Town (富庄镇)
- Qingxi Town (清溪镇)
- Dashu Town (大树镇)
- Huangmu Town (皇木镇)
- Tangjia Town (唐家镇)
- Fuquan Town (富泉镇)
- Anle Town (安乐镇)
- Qianyu Town (前域镇)
- Fuxiang Township (富乡乡)
- Malie Township (马烈乡)
- Henan Township (河南乡)
- Shaijing Township (晒经乡)
- Xiaopu Tibetan and Yi Ethnic Township (小堡藏族彝族乡; ཤའ་ཕུ་བོད་རིགས་ཡི་རིགས་ཞང shaʼ phu bod rigs yi rigs zhang; ꑦꁌꀒꋤꆈꌠꑢ xuo pu op zzup nuo su xiex)
- Pianma Yi Ethnic Township (片马彝族乡; ꀽꂸꆈꌠꑢ pie map nuo su xiex)
- Nimei Yi Ethnic Township (坭美彝族乡; ꆀꂿꆈꌠꑢ nip mo nuo su xiex)
- Yongli Yi Ethnic Township (永利彝族乡; ꑿꆀꆈꌠꑢ yo nip nuo su xiex)
- Shunhe Yi Ethnic Township (顺河彝族乡; ꎵꉼꆈꌠꊨꏦꏱꅉꑢ shop hop nuo su zyt jie jux dde xiex)
Climate
| Climate data for Hanyuan, elevation 1,098 m (3,602 ft), (2009–2020 normals, extremes 1981–2010) | |||||||||||||
|---|---|---|---|---|---|---|---|---|---|---|---|---|---|
| Month | Jan | Feb | Mar | Apr | May | Jun | Jul | Aug | Sep | Oct | Nov | Dec | Year |
| Record high °C (°F) | 20.9 (69.6) |
32.6 (90.7) |
35.6 (96.1) |
36.8 (98.2) |
39.2 (102.6) |
37.1 (98.8) |
38.7 (101.7) |
38.8 (101.8) |
38.5 (101.3) |
32.8 (91.0) |
25.7 (78.3) |
20.6 (69.1) |
39.2 (102.6) |
| Mean daily maximum °C (°F) | 10.8 (51.4) |
14.0 (57.2) |
18.7 (65.7) |
23.2 (73.8) |
25.8 (78.4) |
26.8 (80.2) |
29.1 (84.4) |
30.0 (86.0) |
24.2 (75.6) |
20.2 (68.4) |
16.6 (61.9) |
11.4 (52.5) |
20.9 (69.6) |
| Daily mean °C (°F) | 7.2 (45.0) |
9.2 (48.6) |
13.3 (55.9) |
17.2 (63.0) |
20.2 (68.4) |
21.9 (71.4) |
23.8 (74.8) |
24.5 (76.1) |
20.3 (68.5) |
16.7 (62.1) |
13.0 (55.4) |
8.3 (46.9) |
16.3 (61.3) |
| Mean daily minimum °C (°F) | 4.8 (40.6) |
6.0 (42.8) |
9.8 (49.6) |
13.4 (56.1) |
16.6 (61.9) |
18.8 (65.8) |
20.6 (69.1) |
21.1 (70.0) |
17.9 (64.2) |
14.5 (58.1) |
10.7 (51.3) |
6.2 (43.2) |
13.4 (56.1) |
| Record low °C (°F) | −2.6 (27.3) |
−2.3 (27.9) |
−0.1 (31.8) |
5.6 (42.1) |
8.8 (47.8) |
12.0 (53.6) |
15.2 (59.4) |
14.5 (58.1) |
11.0 (51.8) |
5.4 (41.7) |
2.4 (36.3) |
−1.6 (29.1) |
−2.6 (27.3) |
| Average precipitation mm (inches) | 1.3 (0.05) |
2.4 (0.09) |
24.7 (0.97) |
48.1 (1.89) |
69.3 (2.73) |
115.0 (4.53) |
180.7 (7.11) |
160.6 (6.32) |
104.0 (4.09) |
37.6 (1.48) |
6.0 (0.24) |
1.7 (0.07) |
751.4 (29.57) |
| Average precipitation days (≥ 0.1 mm) | 1.2 | 2.4 | 8.9 | 13.8 | 15.2 | 19.6 | 20.1 | 16.3 | 21.0 | 14.0 | 4.3 | 1.6 | 138.4 |
| Average snowy days | 1.1 | 0.5 | 0 | 0 | 0 | 0 | 0 | 0 | 0 | 0 | 0 | 0.2 | 1.8 |
| Average relative humidity (%) | 57 | 56 | 60 | 64 | 67 | 77 | 78 | 74 | 80 | 76 | 66 | 61 | 68 |
| Mean monthly sunshine hours | 108.0 | 123.2 | 132.1 | 141.8 | 123.4 | 81.0 | 118.1 | 151.0 | 64.3 | 74.6 | 98.6 | 90.4 | 1,306.5 |
| Percent possible sunshine | 33 | 39 | 35 | 37 | 29 | 19 | 28 | 37 | 17 | 21 | 31 | 29 | 30 |
| Source: China Meteorological Administration | |||||||||||||
 Light green -Yi. Red -Tibetan
References
- ^ "雅安市第七次全国人口普查公报(第二号) ——县(区)人口情况" (in Chinese). Government of Ya'an. 2021-06-10.
- ^ Sun, Jiadong.; Liu, Jingnan.; Yang, Yuanxi.; Fan, Shiwei (2012). China Satellite Navigation Conference (CSNC) 2012 Proceedings: The 3rd China Satellite Navigation Conference (CSNC 2012) Guangzhou, China, May 15-19, 2012, Revised Selected Papers. Springer. p. 306. ISBN 978-3-642-29187-6. Retrieved 22 April 2013.
- ^ Wells-Dang, Andrew (4 September 2012). Civil Society Networks in China and Vietnam: Informal Pathbreakers in Health and the Environment. Palgrave Macmillan. p. 166. ISBN 978-0-230-38020-2. Retrieved 22 April 2013.
- ^ 2023年统计用区划代码和城乡划分代码:汉源县 (in Simplified Chinese). National Bureau of Statistics of China.
- ^ 中国气象数据网 – WeatherBk Data (in Simplified Chinese). China Meteorological Administration. Retrieved 10 April 2023.
- ^ 中国气象数据网 (in Simplified Chinese). China Meteorological Administration. Retrieved 10 April 2023.
| International | |
|---|---|
| National | |
This Sichuan location article is a stub. You can help Wikipedia by expanding it. |